This role involves analyzing data to extract insights, developing reports and visualizations, and working extensively with spreadsheets and databases.
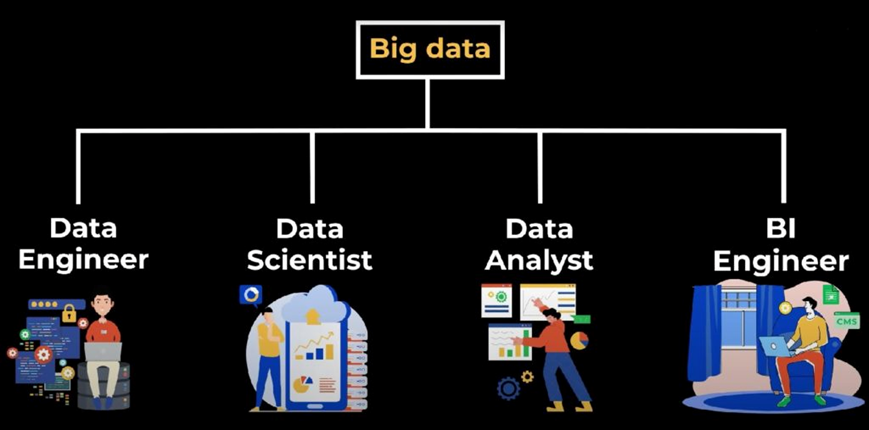
Data analysis is a key area within the broader field of big data, focused on extracting valuable insights from large sets of unstructured information. The professional responsible for examining this data and uncovering meaningful patterns to support organizational decisions is called a data analyst.
Importance of Data Analysis – Example Scenario
In today’s digital era, businesses generate massive amounts of data every day. Data analysis is essential for transforming this raw information into valuable insights that guide informed decision-making, boost efficiency, and uncover new opportunities.
Example Scenario:
Consider an e-commerce company facing a sudden decline in online sales. Without data analysis, the reason behind the drop remains unclear. By examining customer behavior, website analytics, inventory status, and marketing performance, the team discovers that a recent website update caused slower loading times on mobile devices. This led to higher bounce rates and fewer completed purchases.
Armed with this insight, they resolve the technical issue, improve the mobile user experience, and roll out a targeted promotional campaign. As a result, sales bounce back, and customer engagement increases.
The above example illustrates how data analysis is not just about reviewing numbers—it plays a critical role in identifying issues, shaping solutions, and driving business success.
The position focuses on uncovering insights through data analysis, creating detailed reports and visualizations, and handling spreadsheets and databases efficiently.
This role centers on deriving insights from data, designing comprehensive reports and visualizations, and effectively managing spreadsheets and databases.
Data analysis is the practice of uncovering insights to guide smarter business decisions, typically carried out through these 5 repeating phases:
- Identify the data you want to analyze
- Collect the data
- Clean the data in preparation for analysis
- Analyze the data
- Interpret the results of the analysis
Skillset you need:
- Data Analysis
- SQL
- Python Programming
- Data Visualization
- Microsoft Excel
- Statistics
- Problem Solving
- Data Quality
A data analyst collects and interprets data to address specific problems. The role requires working extensively with data while also presenting insights to stakeholders.
Day-to-day activities of a Data Analyst
Collect Data: Analysts may gather data through methods like conducting surveys, tracking user behavior on websites, or purchasing datasets from specialized providers.
Clean Data: Raw data often contains errors, duplicates, or outliers. Cleaning ensures the data is accurate and reliable, using spreadsheets or programming tools to prevent misleading results.
Structure Data: This step involves designing the framework of a database—defining what data to collect, how different data types relate, and how the data will be organized and stored.
Analyze Data: Here, analysts identify patterns, trends, or insights that help answer specific questions or solve problems.
Communicate Findings: A crucial part of the role is sharing results through visual tools like charts and graphs, clear reports, and presentations tailored to stakeholders.
Sure! Here's a rephrased version of the entire section with a smoother, professional flow:
Data Collection
- Information Gathering: Data analysts collect information from a variety of sources, including internal systems, public datasets, and third-party providers.
- Maintaining Data Integrity: It's essential to verify and validate data to ensure it is accurate, complete, and consistent.
Data Processing
- Cleaning the Data: This involves identifying and fixing errors, removing irrelevant entries, and addressing incomplete data.
- Transforming Data: Analysts prepare data for analysis by restructuring, normalizing, handling missing values, and converting data into usable formats.
Data Analysis
- Applying Statistical Methods: Techniques such as regression, hypothesis testing, and variance analysis are used to uncover insights.
- Predictive Analytics: Leveraging statistical models and machine learning algorithms to forecast future trends and behaviors.
Data Visualization
- Report and Dashboard Creation: Visual tools like charts, graphs, and dashboards are developed to present analytical results clearly.
- Interactive Visualizations: Platforms such as Tableau, Power BI, and Qlik are used to create dynamic and interactive visuals for deeper exploration.
Reporting and Decision Support
- Generating Insights: The analysis culminates in actionable insights that support strategic business decisions.
- Communicating Results: Findings are presented through clear reports and presentations, making them accessible to non-technical stakeholders.
Responsibilities and Roles
Responsibilities
Data Collection
- Information Gathering: Data analysts collect information from a variety of sources, including internal systems, public datasets, and third-party providers.
- Maintaining Data Integrity: It's essential to verify and validate data to ensure it is accurate, complete, and consistent.
Data Processing
- Cleaning the Data: This involves identifying and fixing errors, removing irrelevant entries, and addressing incomplete data.
- Transforming Data: Analysts prepare data for analysis by restructuring, normalizing, handling missing values, and converting data into usable formats.
Data Analysis
- Applying Statistical Methods: Techniques such as regression, hypothesis testing, and variance analysis are used to uncover insights.
- Predictive Analytics: Leveraging statistical models and machine learning algorithms to forecast future trends and behaviors.
Data Visualization
- Report and Dashboard Creation: Visual tools like charts, graphs, and dashboards are developed to present analytical results clearly.
- Interactive Visualizations: Platforms such as Tableau, Power BI, and Qlik are used to create dynamic and interactive visuals for deeper exploration.
Reporting and Decision Support
- Generating Insights: The analysis culminates in actionable insights that support strategic business decisions.
- Communicating Results: Findings are presented through clear reports and presentations, making them accessible to non-technical stakeholders.
Tools used:
- Microsoft Excel
- Google Sheets
- SQL
- Tableau
- R or Python
- SAS
- Microsoft Power BI
- Jupyter Notebooks
Specializations in Data Analysis
• Medical and health care analyst
• Market research analyst
• Business analyst
• Business intelligence analyst
• Operations research analyst
• Intelligence analyst
Requirements for becoming a DA
Core knowledge:
Statistical analysis, programming, and data visualization are key competencies. This includes understanding statistical tests and distributions, using programming languages such as Python, R, or SQL for data manipulation, and creating clear visualizations with tools like Tableau or Power BI to effectively communicate insights.
Techs and Tools:
Gain familiarity with Big Data platforms such as Hadoop or Spark, which are widely used in modern data analysis. A foundational knowledge of machine learning methods adds significant value. Additionally, learning automation tools can help optimize and simplify data collection and analysis workflows.
Networking:
Attend Events: Participate in conferences, workshops, and webinars to keep up with the latest trends and grow your professional network.
Engage in Online Communities: Contribute to forums like Stack Overflow and GitHub to exchange knowledge, solve problems, and learn from fellow data professionals.
Join Professional Associations: Become a member of industry groups such as the Data Science Association to connect with peers and stay informed.
Gain Proficiency in Essential Data Tools and Coding Languages: Begin with Excel to learn the basics of data manipulation. As your skills grow, explore more advanced tools like SQL for querying data, Python or R for analysis, and visualization platforms such as Tableau or Power BI. For a clearer picture of the essential tools and a structured learning path, refer to this article on the data analyst syllabus.
Self-Directed Projects: You can kickstart your data analysis journey by working with publicly available datasets. Projects such as analyzing weather patterns, sports statistics, or economic trends are great ways to uncover insights and build a strong portfolio.
Certifications: Enhance your resume by enrolling in structured courses that provide certifications, such as the Data Analytics Professional Certificate. Earning certifications from reputable platforms not only strengthens your skill set but also adds credibility—especially valuable if you're still building professional experience.
Soft sills: Sharpening skills such as problem-solving, critical thinking, clear communication, and attention to detail is vital, particularly when translating complex data insights for audiences without a technical background.
Technical skills needed:
- Statistical Analysis: A strong grasp of statistical techniques is essential for interpreting datasets and drawing meaningful conclusions. Familiarity with tools like R or SPSS can enhance your analytical capabilities.
- Programming Skills: Proficiency in languages such as Python and R is important for tasks like data manipulation, analysis, and process automation.
- Database Knowledge: Understanding database systems and being able to write queries using SQL is key for retrieving and managing data effectively.
- Data Visualization: The ability to present data through visuals—using tools like Tableau, Power BI, or advanced Excel—is crucial for communicating insights to non-technical audiences.
- Machine Learning: While not always a core requirement, having a basic understanding of machine learning methods is a valuable asset, especially for performing predictive analysis.
Opportunities for Data Analysts
Sure! Here's a rephrased version of your list with smoother language and varied sentence structures:
- Business Analyst: Business analysts leverage data to drive strategic decisions, enhance business processes, and streamline operations. They collaborate with stakeholders to understand organizational needs and deliver data-informed solutions.
- Financial Analyst: These professionals evaluate financial data to support investment strategies, project financial outcomes, and analyze market dynamics. They typically work in sectors like banking, investment, and insurance.
- Marketing Analyst: Marketing analysts examine consumer behavior, industry trends, and campaign results to craft effective marketing strategies. Their insights help boost campaign performance and return on investment.
- Operations Analyst: Focused on efficiency, operations analysts assess workflows, systems, and processes to identify inefficiencies and propose solutions that enhance productivity and operational performance.
- Data Scientist: Data scientists apply sophisticated statistical methods and machine learning techniques to interpret complex datasets. Their work includes building predictive models, conducting data mining, and performing big data analysis.
- Product Analyst: Product analysts analyze data related to product usage, customer feedback, and market trends to guide product development decisions and recommend enhancements.
Key field of work:
• Data management
• Data analysis and reporting
• Process automation
• Data validation
• KPI tracking
• Benchmarking.
Your specific responsibilities will depend on your role, industry, and employer. However, typical duties may include:
- Designing and implementing secure, efficient, and compliant data collection systems, ensuring data quality through error detection and cleaning.
- Developing policies and processes for effective records management and reporting.
- Enhancing efficiency by automating data workflows and building optimized data pipelines.
- Researching, evaluating, and integrating external tools and services to support data validation and cleansing.
- Gathering, analyzing, and documenting detailed business requirements using appropriate methods.
- Collaborating with stakeholders to understand and confirm data needs, ensuring accurate and meaningful reporting.
- Defining and tracking KPIs and metrics to assess business performance.
- Auditing data quality and ensuring adherence to data standards.
- Designing surveys and analyzing survey results for actionable insights.
- Manipulating and interpreting complex datasets relevant to business objectives.
- Creating data visualizations and reports using tools like Tableau, Power BI, and SQL, and clearly communicating findings to both technical and non-technical audiences.
- Building interactive dashboards, graphs, and other visual tools to support decision-making.
- Performing industry and competitor analysis to drive strategic improvements.
- Staying informed on the latest trends and best practices in data analytics.
Employers/Industries:
- Consultancies
- Government
- Higher education institutions
- IT firms
- Insurance companies
- Marketing firms
- Hospitals
- Pharmaceutical companies
- Professional services firms
- Retail companies
- Telecommunications companies
- The media.
Keeping your data analysis skills current is essential, and continuing professional development (CPD) plays a key role in this. Whether you're refining existing abilities or expanding into new areas, ongoing learning helps you stay competitive. You can pursue courses or certifications in topics such as:
- Advanced data visualization tools
- Database management
- Big data technologies
- Machine learning techniques
- Programming languages like Python or R
- Statistical analysis methods
- Artifical Iintelligence applications in data analysis
Roadmap
Language
Python is one of the most widely used programming languages in data analysis and is often referred to as the "language of data." Beginners can start by learning foundational concepts like syntax, loops, functions, and data structures.
While some may question the need for programming in data analysis, relying solely on enterprise tools can limit your growth. To advance in this field, programming knowledge is essential.
Once you’re comfortable with the basics of Python, you can explore data-focused libraries such as Pandas and NumPy. Pandas is especially popular for performing data analysis tasks in Python, while NumPy supports efficient numerical operations.
Data Structure and Algorithms (DSA)
Having a basic understanding of data structures and algorithms (DSA) is essential for becoming proficient in data analysis. You don't need to be an expert coder, but it's important to grasp core concepts like strings, arrays, linked lists, stacks, and queues. Practicing problems at an easy to medium difficulty level will be enough to build a strong foundation.
DB
Databases are primarily used to store data and information, making them essential tools for data analysts. Understanding which type of database to use is a fundamental skill in this role. Before diving into specific databases, it’s important to learn the basics of DBMS (Database Management Systems).
As a data analyst, you'll frequently work with both transactional databases like MySQL and PostgreSQL, as well as NoSQL databases such as MongoDB and Cassandra, depending on the data structure and use case.
BIG DATA
Data analysis is a specialized area within the broader field of big data. A good starting point is to familiarize yourself with fundamental concepts such as distributed computing, distributed storage, common file formats (like JSON, CSV, and Parquet), and various data types—structured, unstructured, and semi-structured.
Once you have a grasp of the basics, you can move on to learning big data frameworks like Hive, which is widely used as a data warehousing and query tool.
Dashboarding tool
As a Data Analyst, your main focus lies in effectively representing data. Dashboarding tools, which typically offer user-friendly drag-and-drop features, are used to create visual elements like charts and graphs.
Tableau and Power BI are two of the most popular tools in this space. They help you analyze data, uncover insights, and share those findings across different teams and departments within the organization.
Warehousing
Transformed data is stored in a well-organized, structured format—a process known as data warehousing. Common tools used for this purpose include Hive, Amazon Redshift, and others.
EXCEL
Although it's a classic office tool, Excel still holds strong in the data analyst’s toolkit—especially when presenting to or collaborating with clients, who often favor Excel for its familiarity. Analysts use Excel extensively for organizing data, performing calculations, and generating visual elements like graphs, charts, and pivot tables.
ETL (extract, transform, and load) tools
These tools are primarily used to connect and integrate data from multiple sources—such as combining datasets, databases, or tables. Popular options include Informatica and Tabular, which are commonly used for enterprise-level data extraction, transformation, and loading (ETL) processes.
StatIstics
As a Data Analyst, statistical concepts are a fundamental part of your daily work. You’ll frequently rely on techniques such as mean, median, mode, standard deviation, permutations and combinations, and probability to interpret and analyze data effectively. These concepts help you understand data distributions, identify trends, and make informed decisions based on patterns and variability within datasets. A strong foundation in statistics not only enhances your analytical capabilities but also strengthens your ability to communicate findings with clarity and accuracy.
Join Data Analyst Courses
Thease are:
Conclusion
Conclusion:
A career in data analysis offers a dynamic and rewarding path for those who enjoy working with data to uncover insights and drive informed decision-making. With the growing demand for data-driven strategies across industries, skilled data analysts are more valuable than ever. By building a solid foundation in statistics, programming, data visualization, and business understanding, you can thrive in this evolving field. Whether you're just starting out or looking to advance your skills, the opportunities in data analysis are vast—empowering you to make a real impact through the power of data.